This funciton plots n lines in a ggplot.
plotnlines(dat, titleyaxis = "", title0 = "")Arguments
| dat | Default data. |
|---|---|
| titleyaxis | y-axis title. |
| title0 | Title of plot. |
Examples
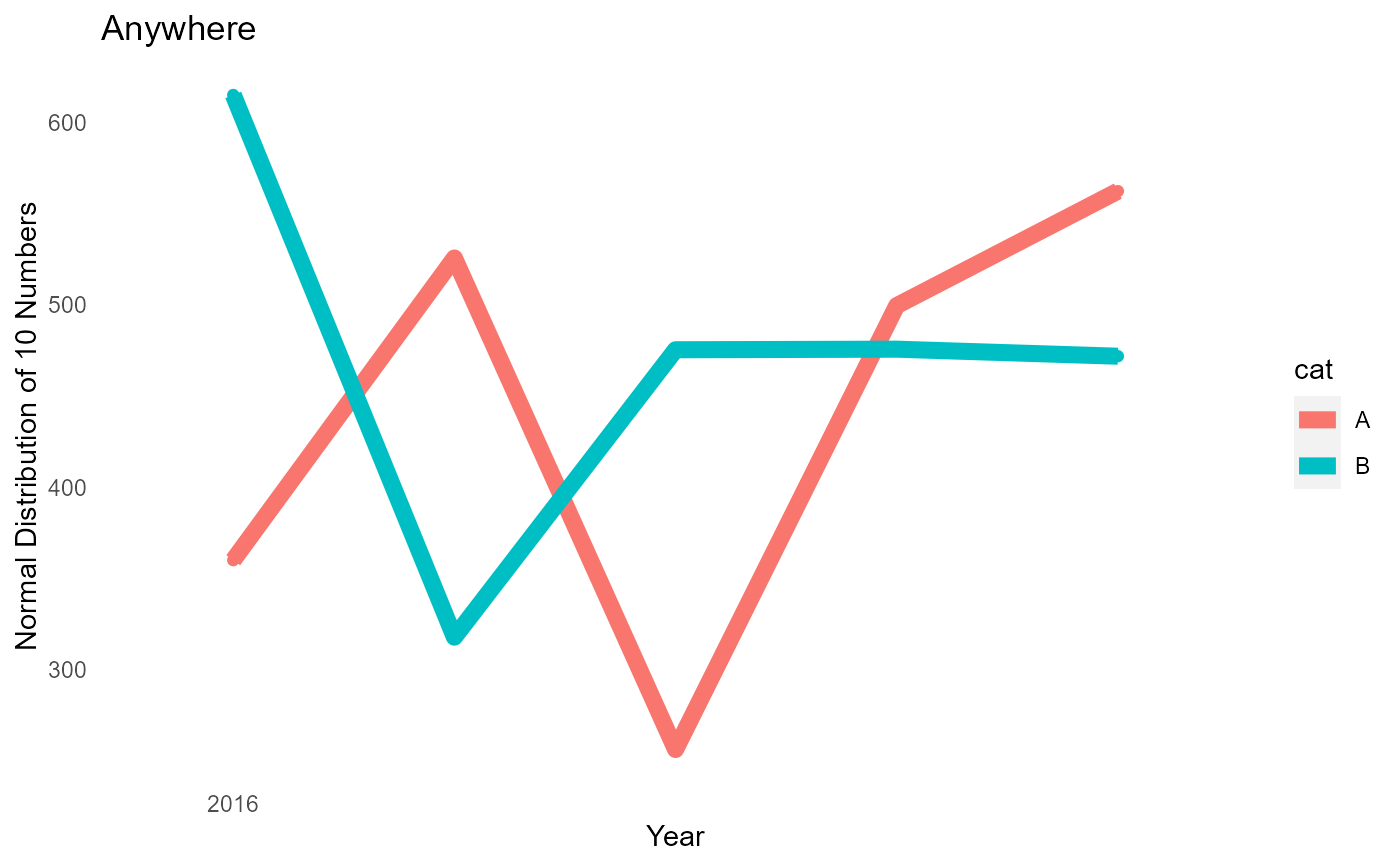
dat<-data.frame(Year = c(2016:2020, 2016:2020),
                val = rnorm(n = 10, mean = 500, sd = 100),
                cat = c(rep_len("A", 5), rep_len("B", 5)))
plotnlines(dat = dat,
           titleyaxis = "Normal Distribution of 10 Numbers",
           title0 = "Anywhere")
#> Warning: `guides(<scale> = FALSE)` is deprecated. Please use `guides(<scale> = "none")` instead.